Ethics and Bias in Data Science
Amazon wanted to create an automated recruitment tool. The purpose of the tool was to take as input, the resumes of applicants and output the top profiles for employment. Excellent use of machine learning for a real-world application. Yes, but their recruitment tool did not like women.
Amazon for training their machine learning algorithm used the resumes submitted by applicants in the past 10 years. As reported by Reuters, the recruitment tool’s machine learning algorithm was penalizing women and was undermining two all-women colleges while returning the top profiles for the job. Amazon scrapped the project and their recruiters claimed that they never used this tool for the intended purpose.
Today, Linkedin shows a ranked list of suitable candidates to the recruiters who posted a job on the site. How confident are you about the Linkedin’s ranking algorithm for a job posting after reading about Amazon’s resume review tool?
In 2018, Joy Buolamwini was a graduate student studying at M.I.T Media lab. She was working on a project for which she used Artificial Intelligence-powered facial recognition software. The software could not recognize her dark skin. Joy had to rely on her white roommate for authentication by the facial recognition software. Later she used a white facial mask for authentication by the AI software.

(Image credit: https://time.com/)
Joy researched gender recognition using face using machine learning algorithms by companies like Amazon, Microsoft and IBM, etc. As reported in the Time article, these machine learning algorithms performed very well on light-skinned males (the error rate was less than 1%). On black-skinned females, the error rate went up to 35%. A more astonishing fact is, the big giant’s machine learning algorithms could not predict the gender of famous personalities like Michelle Obama, Oprah Winfrey, Serena Williams among others.
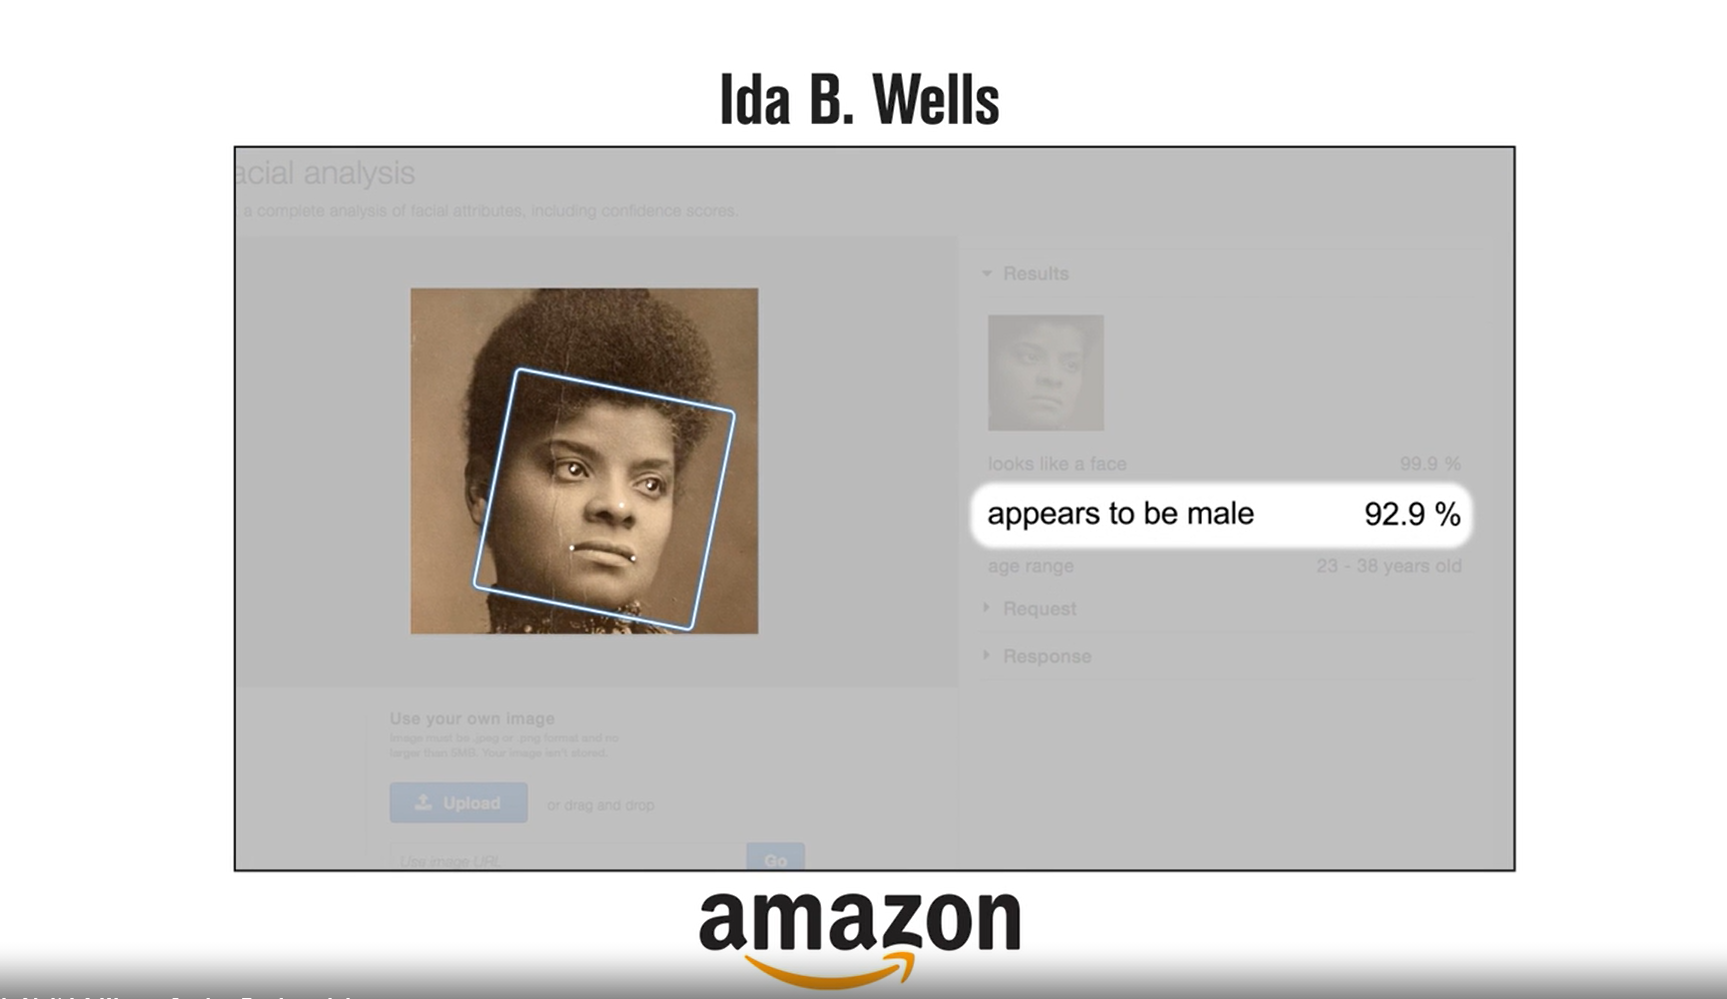
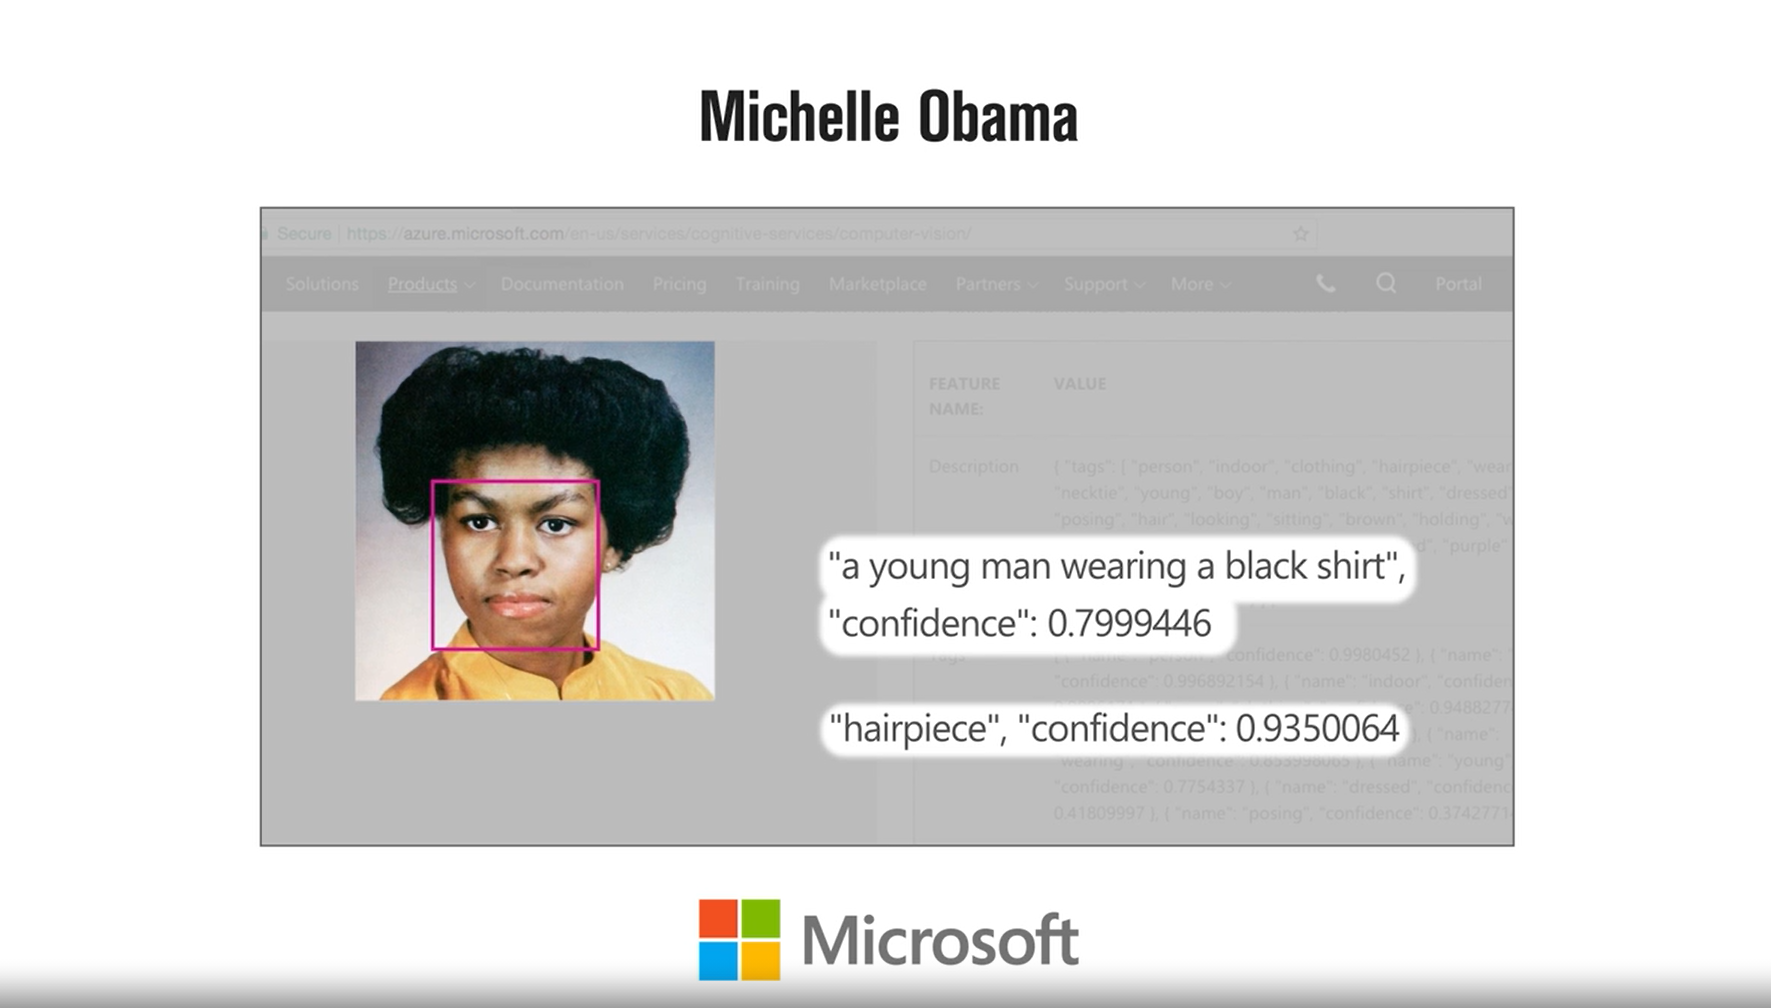
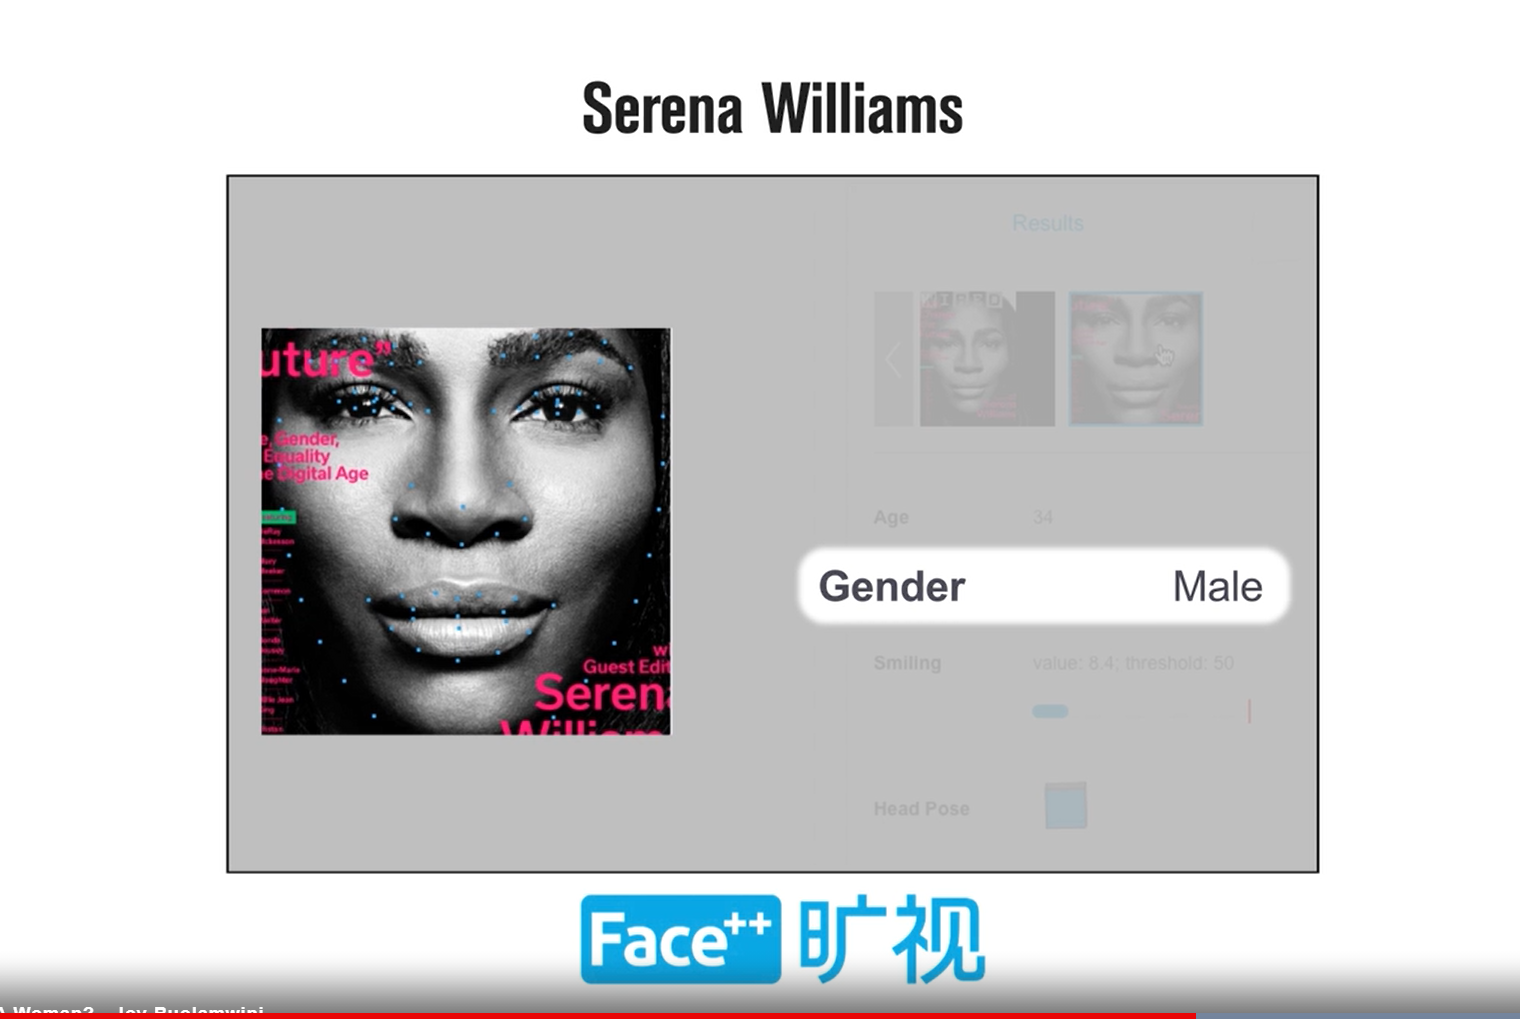
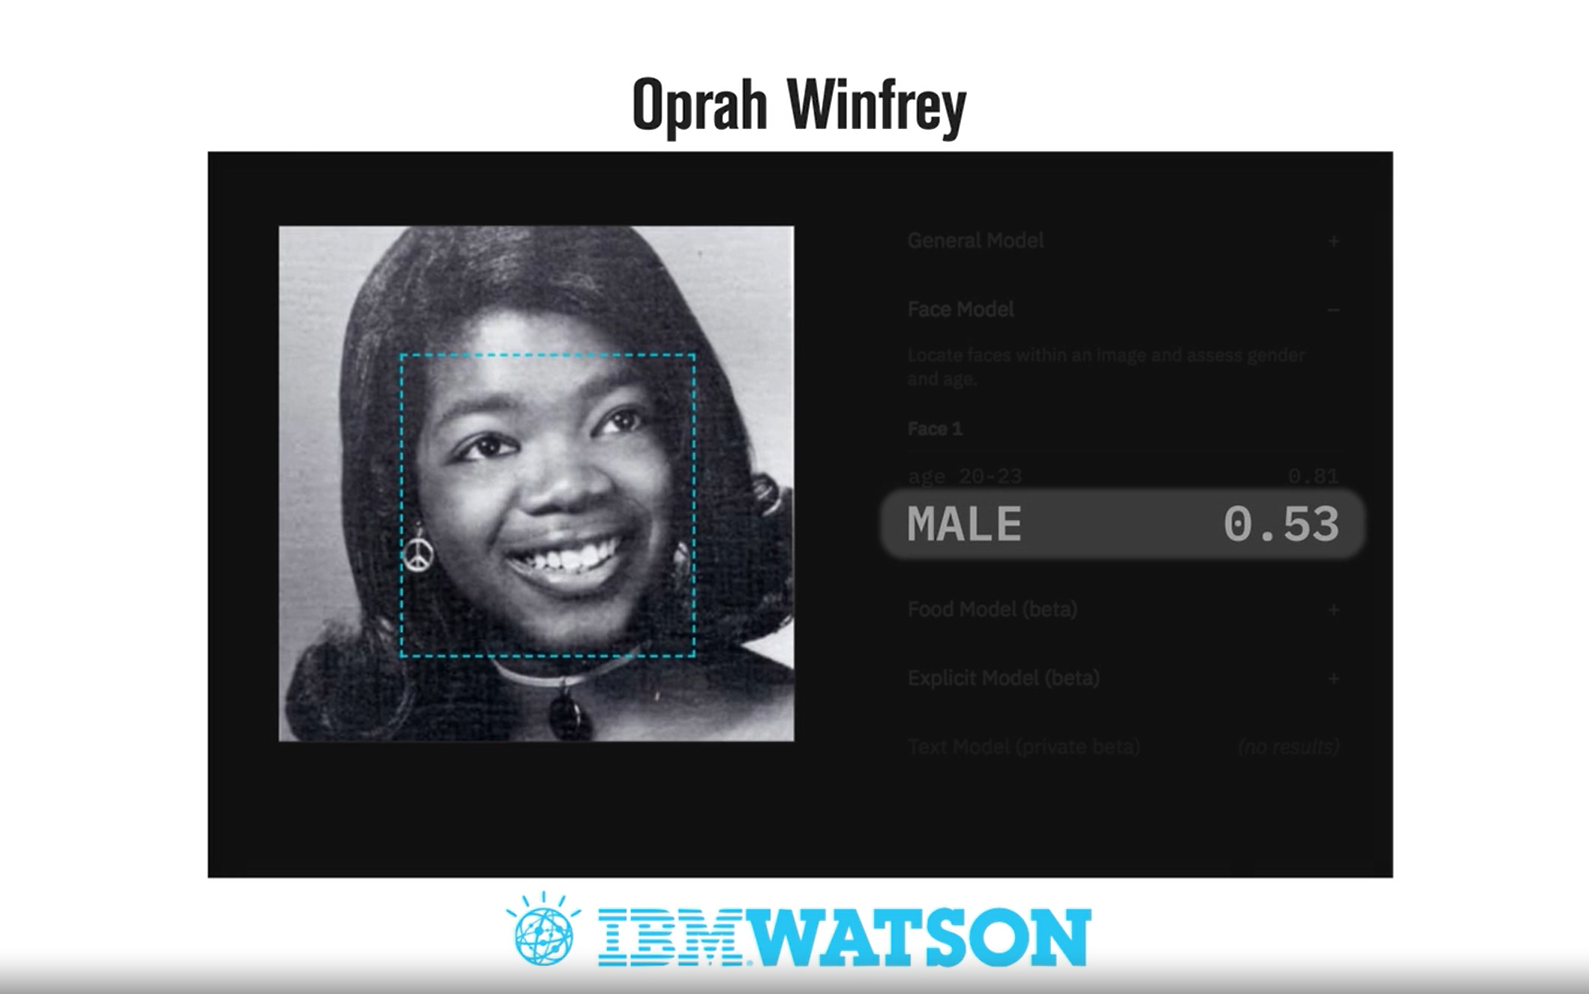
(Image credit: https://time.com/)
As reported by bbc in 2015, Google photo app mistakenly labelled an African American couple as Gorilla. After they reported the incident, Google apologised for the mistake.
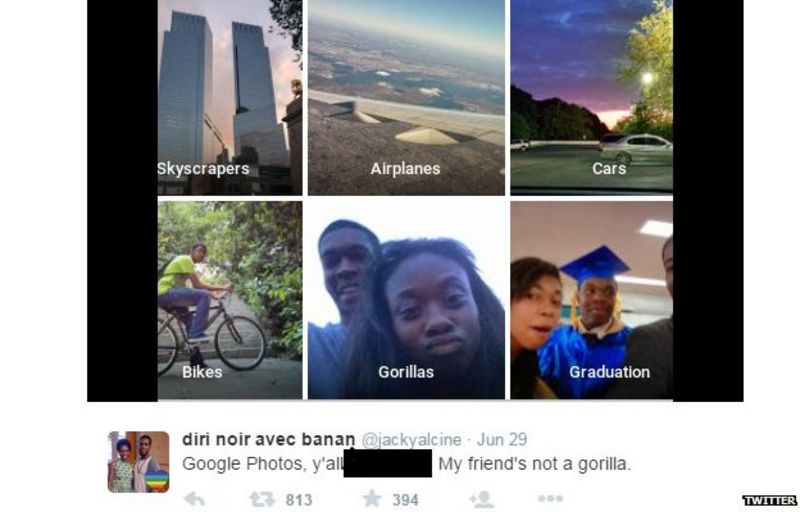
(Image credit: https://www.bbc.com/)
As elaborated in the above examples, building machine learning systems comes with great responsibilities. This blog post talks about ethics and fairness when dealing with data and building machine learning models. This blog post is the first in a series of three parts. In this first post, we will talk about bias and why it exists in data and machine learning models. In the second post, we will look at how to mitigate the bias in the data and improve the fairness of the ML models.
Bias is an overloaded term. In this blog post, bias does not mean underfitting, that is when a machine learning algorithm cannot capture the underlying patterns in the data. In this blog, bias means, “inclination or prejudice for or against one person or group, especially in a way considered to be unfair” as defined in the Oxford dictionary.
Bias in Data and Machine learning models
As Kate Crawford informs in her 2017 NIPS keynote, the biases in its various forms will affect the individuals, groups and society by hurting the allocation of resources, misrepresenting the identities and wrong classifications.
A bank’s denying mortgage or insurance to applicants based on age, gender or race is an example of the ML model’s impact on the allocation of resources.
Everyone interested in Data science and machine learning knows word embeddings, which can explain the representation of identities. These embeddings exhibited stereotypes to a concerning extent. Word embeddings when asked ‘Man is to computer programmer as woman is to’ spitted out ‘Homemaker’. ‘Man is to Doctor as Woman is to’ word embedding answered ‘Nurse’. In one study they found that out of 200 adjectives related to men and women, 76% of them were men related. Out of the remaining 24%, over 50% of the adjectives are beauty-related.
Predictive policing and risk scoring of defenders in the US are an example of bias affecting the classification. In US many states use ‘Risk scoring’ by machine learning algorithms for judiciary like deciding about defendant’s freedom, bond amount etc. COMPAS is a software product by Northpointe which provides the risk score to the correction industry. ProPublica analyzed the recidivism of Broward County using Northpointe’s assessment tool. This tool correctly predicts recidivism 61% of the time. It labelled 44.9% of African American as a higher risk but they didn’t re-offend. The corresponding number for white is 23.5%. COMPAS labelled 47.7% of white as a lower risk who re-offended. The corresponding number for African American is 28%. COMPAS algorithm is biased against the African American population.
Till now we discussed the impact of bias in data and ML. Let us now turn our attention to the different biases which can exist in the data and the models. Harini Suresh and John V Guttag from MIT in their paper, ‘A framework for understanding unintended consequences of machine learning’ categorizes bias’ as: -
- Historical Bias
- Representation Bias
- Measurement Bias
- Aggregation Bias
- Evaluation Bias
- Deployment Bias
Let us discuss each of the different biases. In the next part, we will look at how to mitigate them. In the next part, we will also look at a code sample in python to learn how to de-bias the data/model to improve fairness.
Historical Bias
This is Data inherently reflecting the societal and cultural bias from which we collected it. This bias will be present, even if we use correct sampling techniques. For example, in 2018 5% of the CEO population were women. It is a hard question to answer how to use this data in an industrial scenario. For example, if we are building a search engine and if someone searches for CEO, how should we show the images for CEO? Should we show 95% male images in suits which reflect the true state of the society? Or should we equally show male and female images? we should contemplate the questions and take deliberate action which helps restore equality in this ever-growing unequal world.
Representation Bias
It will not be an exaggeration if someone says that every data scientist will know ImageNet dataset. How many of us thought about the representation of the images before applying a machine learning algorithm on the ImageNet? 45% of the images in ImageNet are from the US and most other images are from western Europe. Only 3.1% of the images are from India and China. We don’t require a data scientist to tell how a machine learning algorithm trained on ImageNet will perform on images from India or any other under-represented part of the world. One more example is data collected using smartphones. This will under-represent the population from low-income groups and senior citizens who prefer not to use smartphones.
Measurement Bias
Bias may enter the data because the proxies we select in place of actual features may contain noise. The measurement process may be noisy. The measurement process may include feedback loops which may introduce further bias in our data as they feed again it to the model. Predictive policing done in under-represented areas of population will lead to more arrests from those areas. The arrests in the areas will lead to more predictive policing in such areas. This will lead to a vicious feedback loop if we do not take some concrete action to break the loop.
Aggregation Bias
This is like a one-size-fits-all model for all the sub-groups in the data. The different sub-groups may be sensitive to different variables and thresholds. The single model created may end up performing worse for all the sub-groups. For example, we know diabetes to have a different effect on different ethnicities. Creating a single diabetes model for all ethnicities will lead to underperformance. The difference in representation may also lead to a difference in the performance of the algorithm for the sub-groups.
Evaluation Bias
This can occur when we use a misrepresented dataset for testing or benchmarking. The representation of data will be different for the training and testing algorithm. The metric selected for evaluation may not be suitable for the problem at hand. For example, selecting a single metric like accuracy for commercial facial recognition algorithm or gender recognition algorithm. The metric may perform well on the overall population, but when tested on sub-sections of the population it suffers. Selecting a single metric for the whole data will make it easy to measure performance, but will have its downsides.
Deployment Bias
If the purpose for which we do modelling differs from the purpose for which it is used, then it will lead to deployment Bias. If the data distribution in training differs from the data distribution in production, then also it leads to deployment bias. An Example, COMPAS does risk scoring to predict if a person will commit a crime. If a judge uses the score in ‘off label’ ways in various steps of the judiciary process, then it is deployment bias.
We discussed various types of biases which can occur at different life stages of a machine learning problem. We also reasoned the impact of bias on individuals, groups and society - Allocation of resources, representation of identities and classification. In the second part, we will examine how to mitigate bias and improve the fairness of our data and models. It is not always possible to make the data or model 100% fair. But as a data scientist, we should try our best to restore the balance and help create a fair world.