Predicting poverty
Approach 1 - Nightitme Lights
Research by J Neal et al.
- Use Nighttime light values (NLV) as a proxy for poverty
- Dataset provided by Earth Observation Group and Images from Google Static Map at 2.5 Meters of resolution
- Using nightlights as a proxy for development. Nightlights data cannot be directly used because there is less difference in luminosity between rich and poor regions in Africa
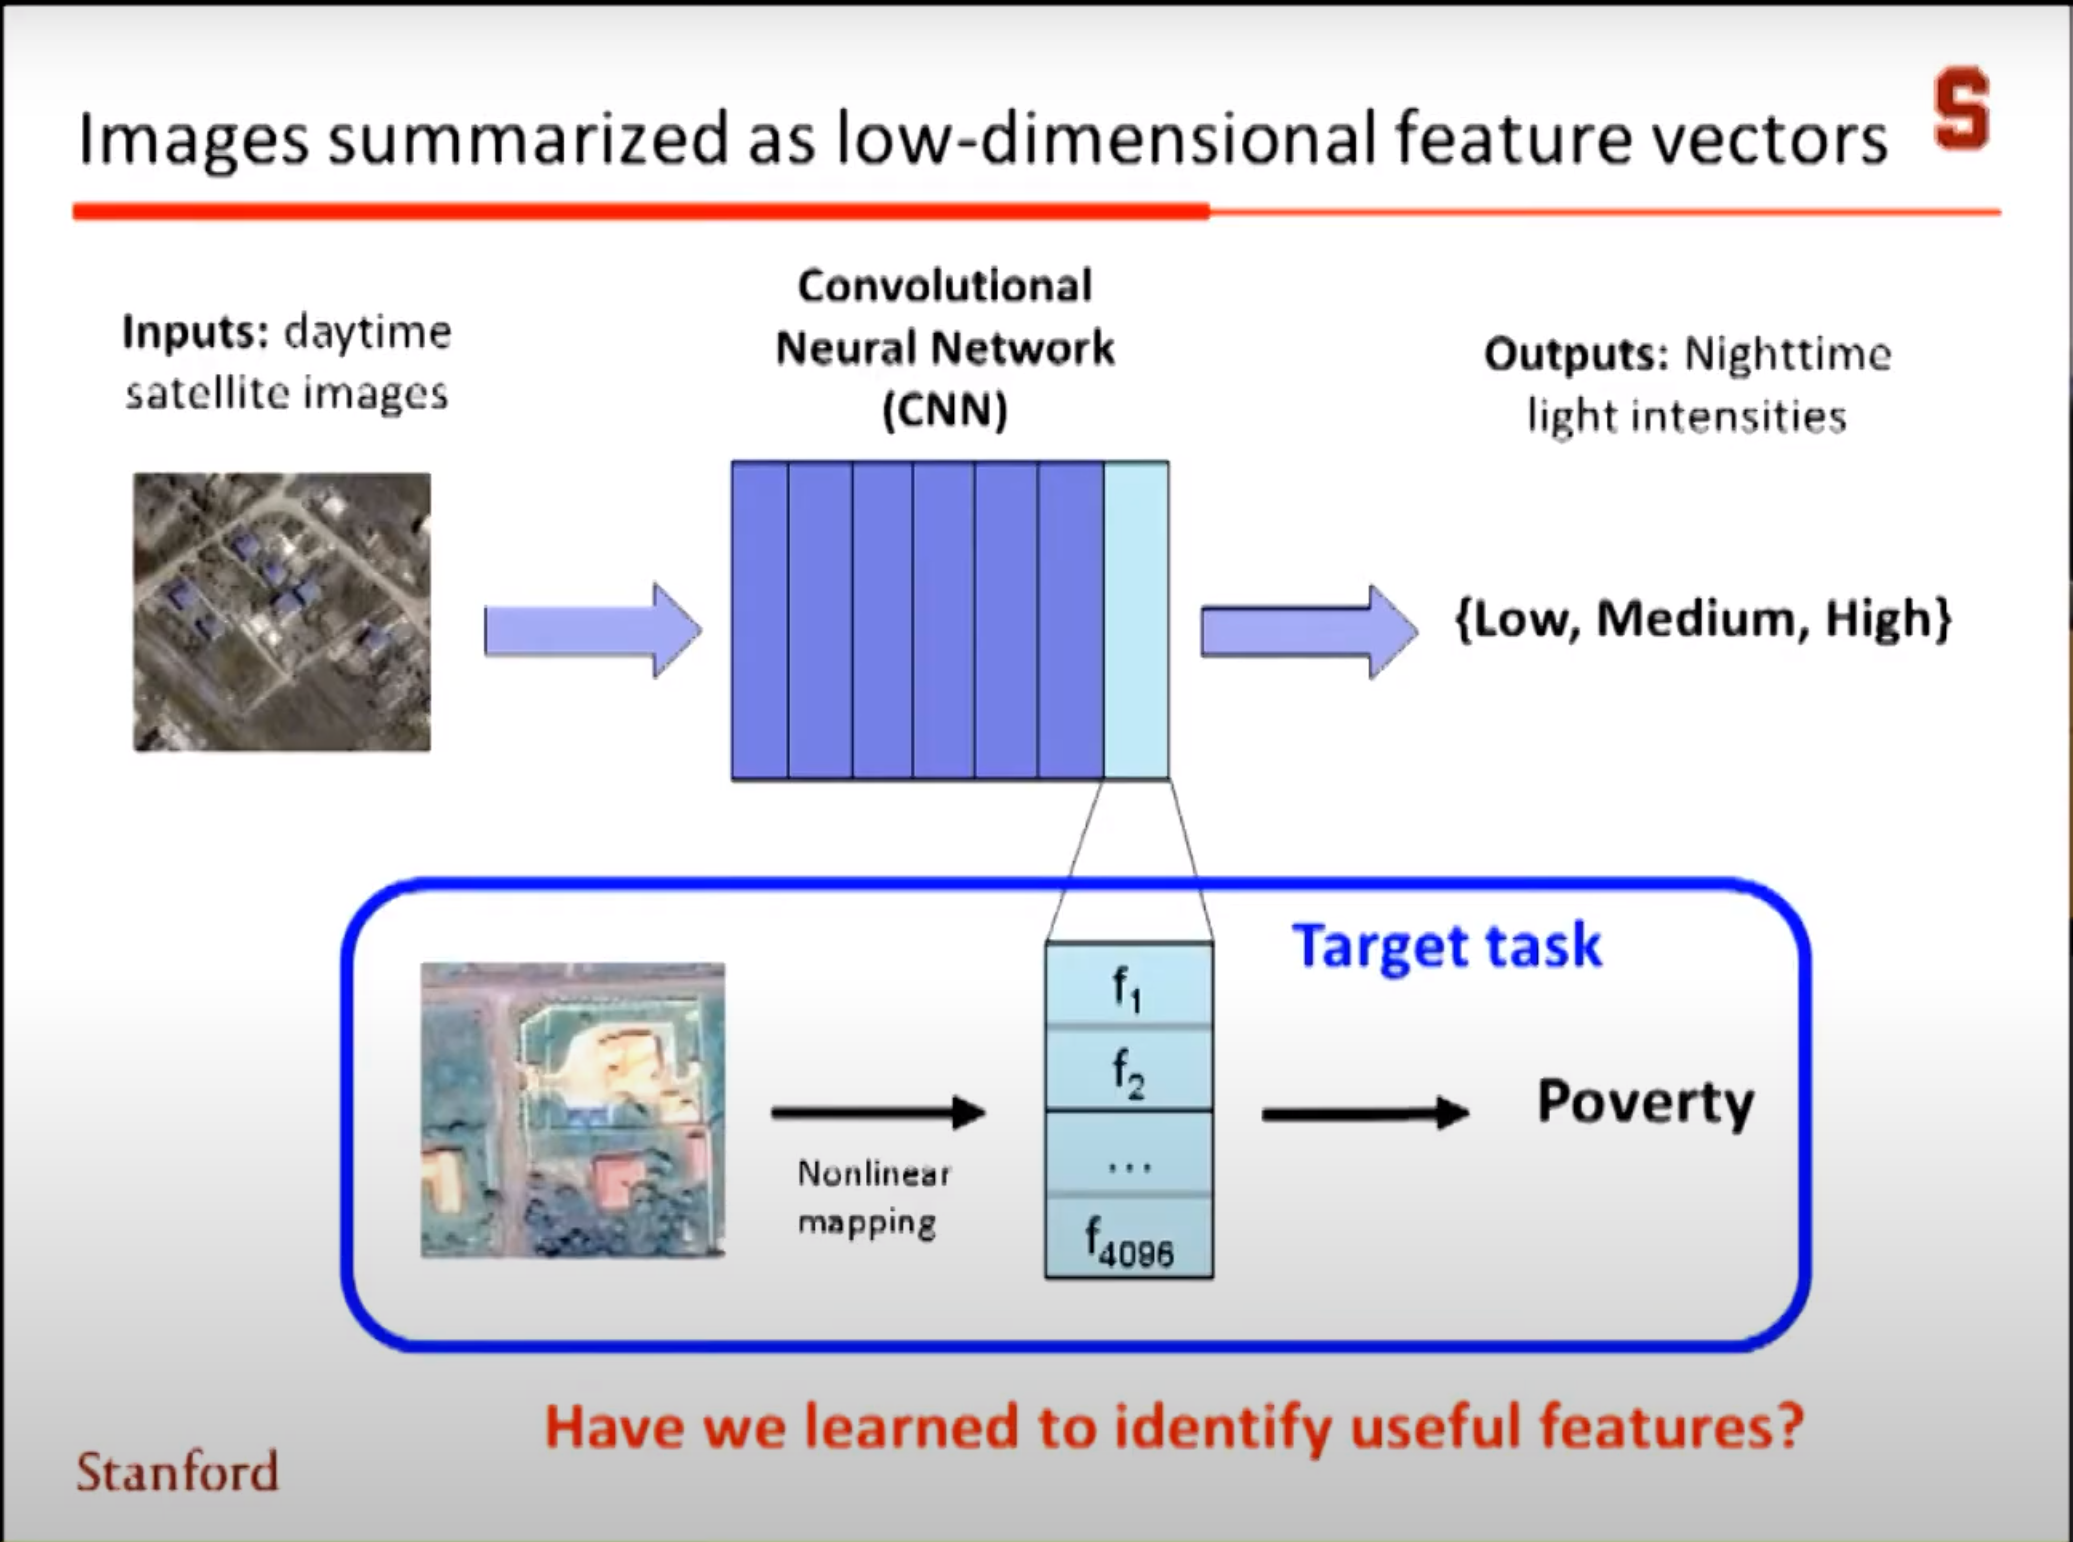
- Use Day images which capture more information and use night images as label data.
- Use transfer learning to learn features from day satellite images and NLV labels
- Train the model and learn important features. These features are calculated for a new image.
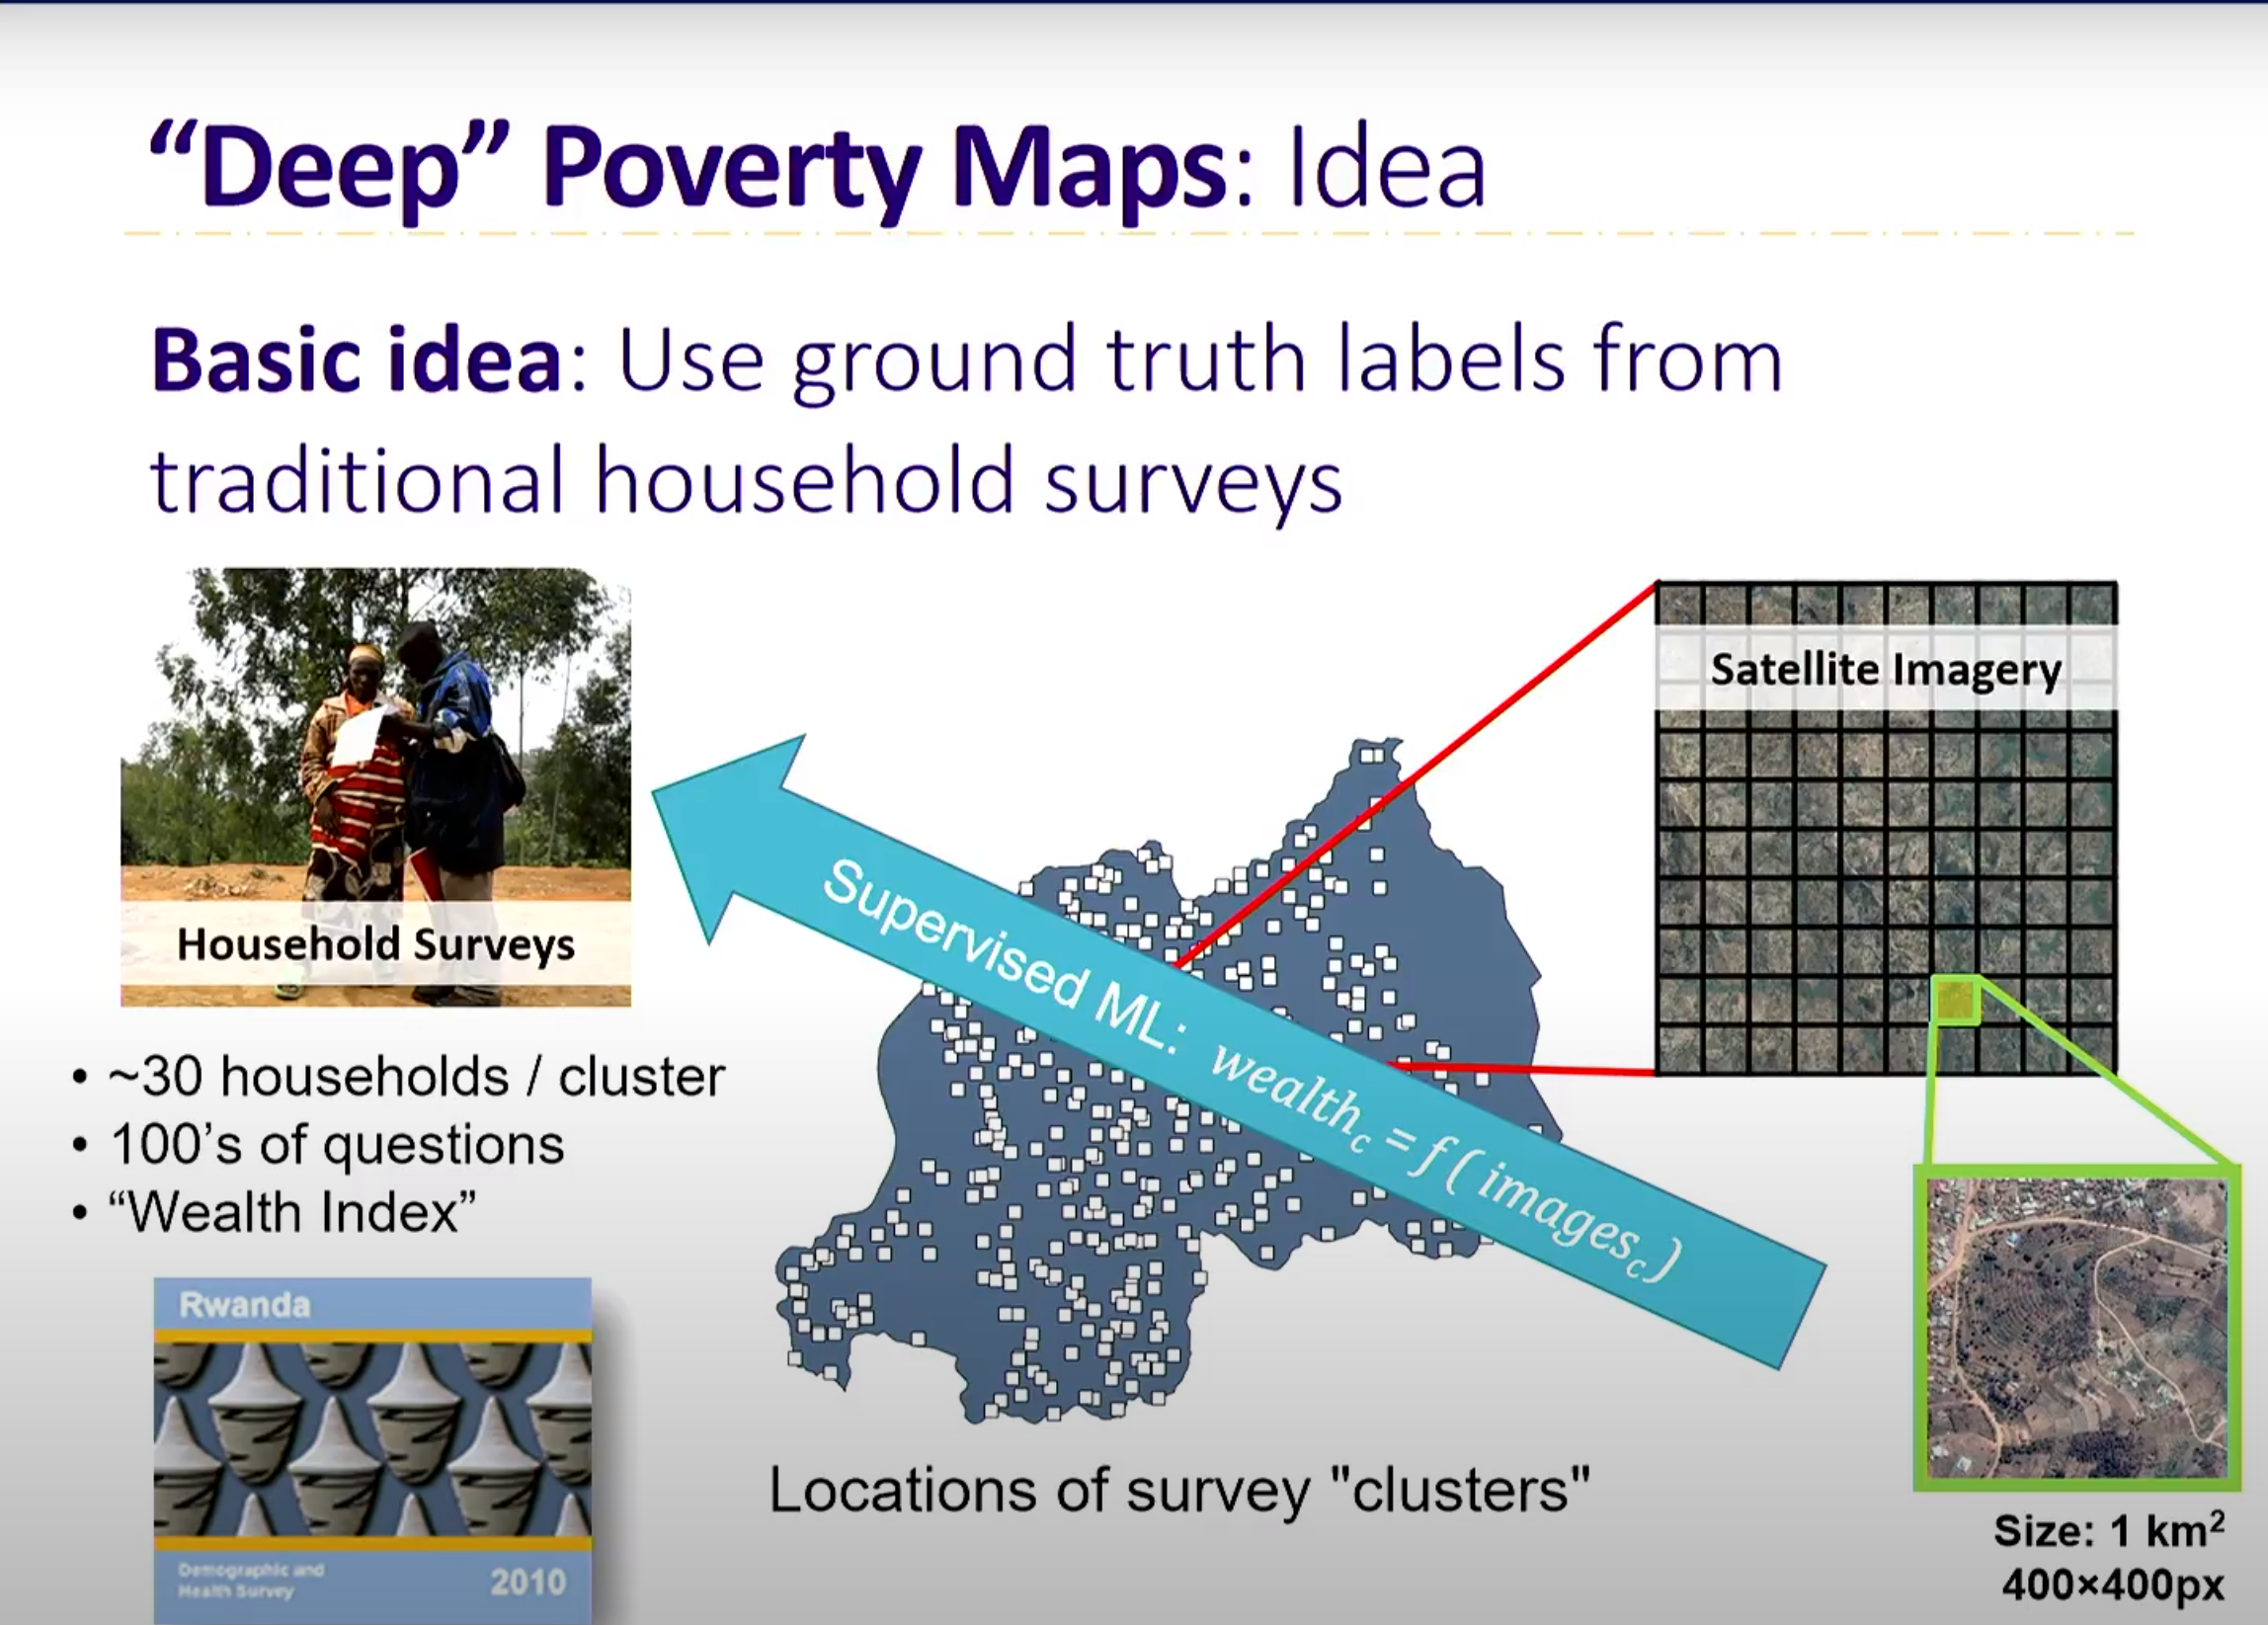
- Use these learned features along with survey data at cluster level to train the model.
- As the cluster level data is very less, use simple models
- Use the trained model for classifying new clusters or areas
Approach 2 - DHS Data & Phone CDR
Research by Prof.Joshua Blumenstock et al.
- Publicly available satellite-based estimates of poverty are available
- The estimation methods use deep learning models trained on Demographic and Health Surveys (DHS) data from neighbouring countries to estimate the average relative wealth of each 2.4km tile in Togo
- This is used to do cluster level predictions
- Identify the clusters
- Use phone CDR as independent variables and survey data as dependent variable to build models for each household
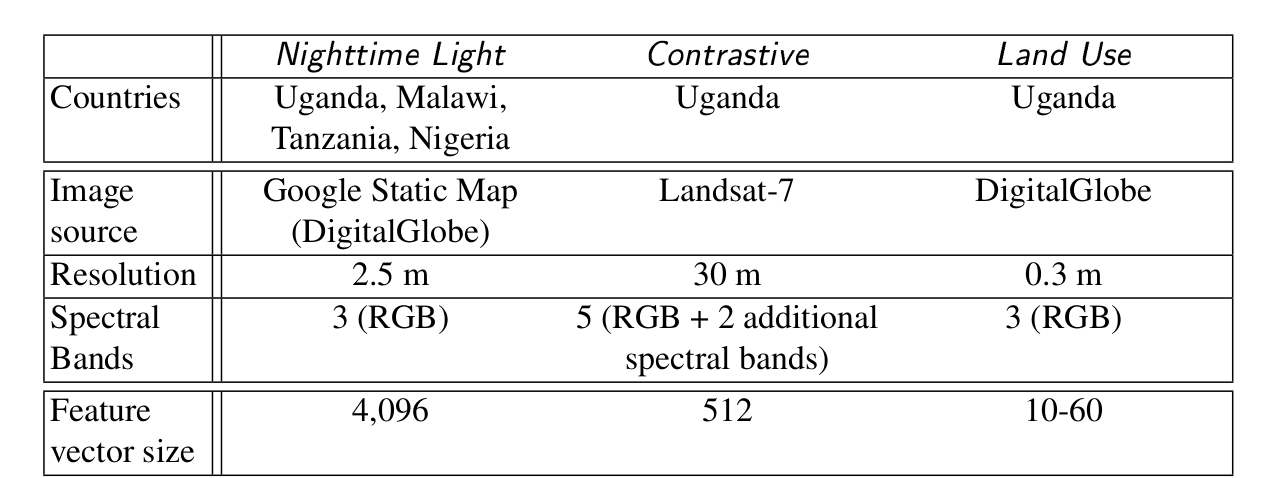
Approach 3 - Land Use
Research by Ayush et al 2020
- Land use and the manufactured objects observed in a satellite image emphasize the wealthiness of an area
- CNN was trained on a land use detection and classification task
- They used xView data consisting of very high resolution images annotated with bounding boxes defined over 10 main classes (building, fixed-wing aircraft, passenger vehicle, truck, railway vehicle, maritime vessel, engineering vehicle, helipad, vehicle lot, construction site) and 60 sub-classes.
- Yolo V3 was used for object detection
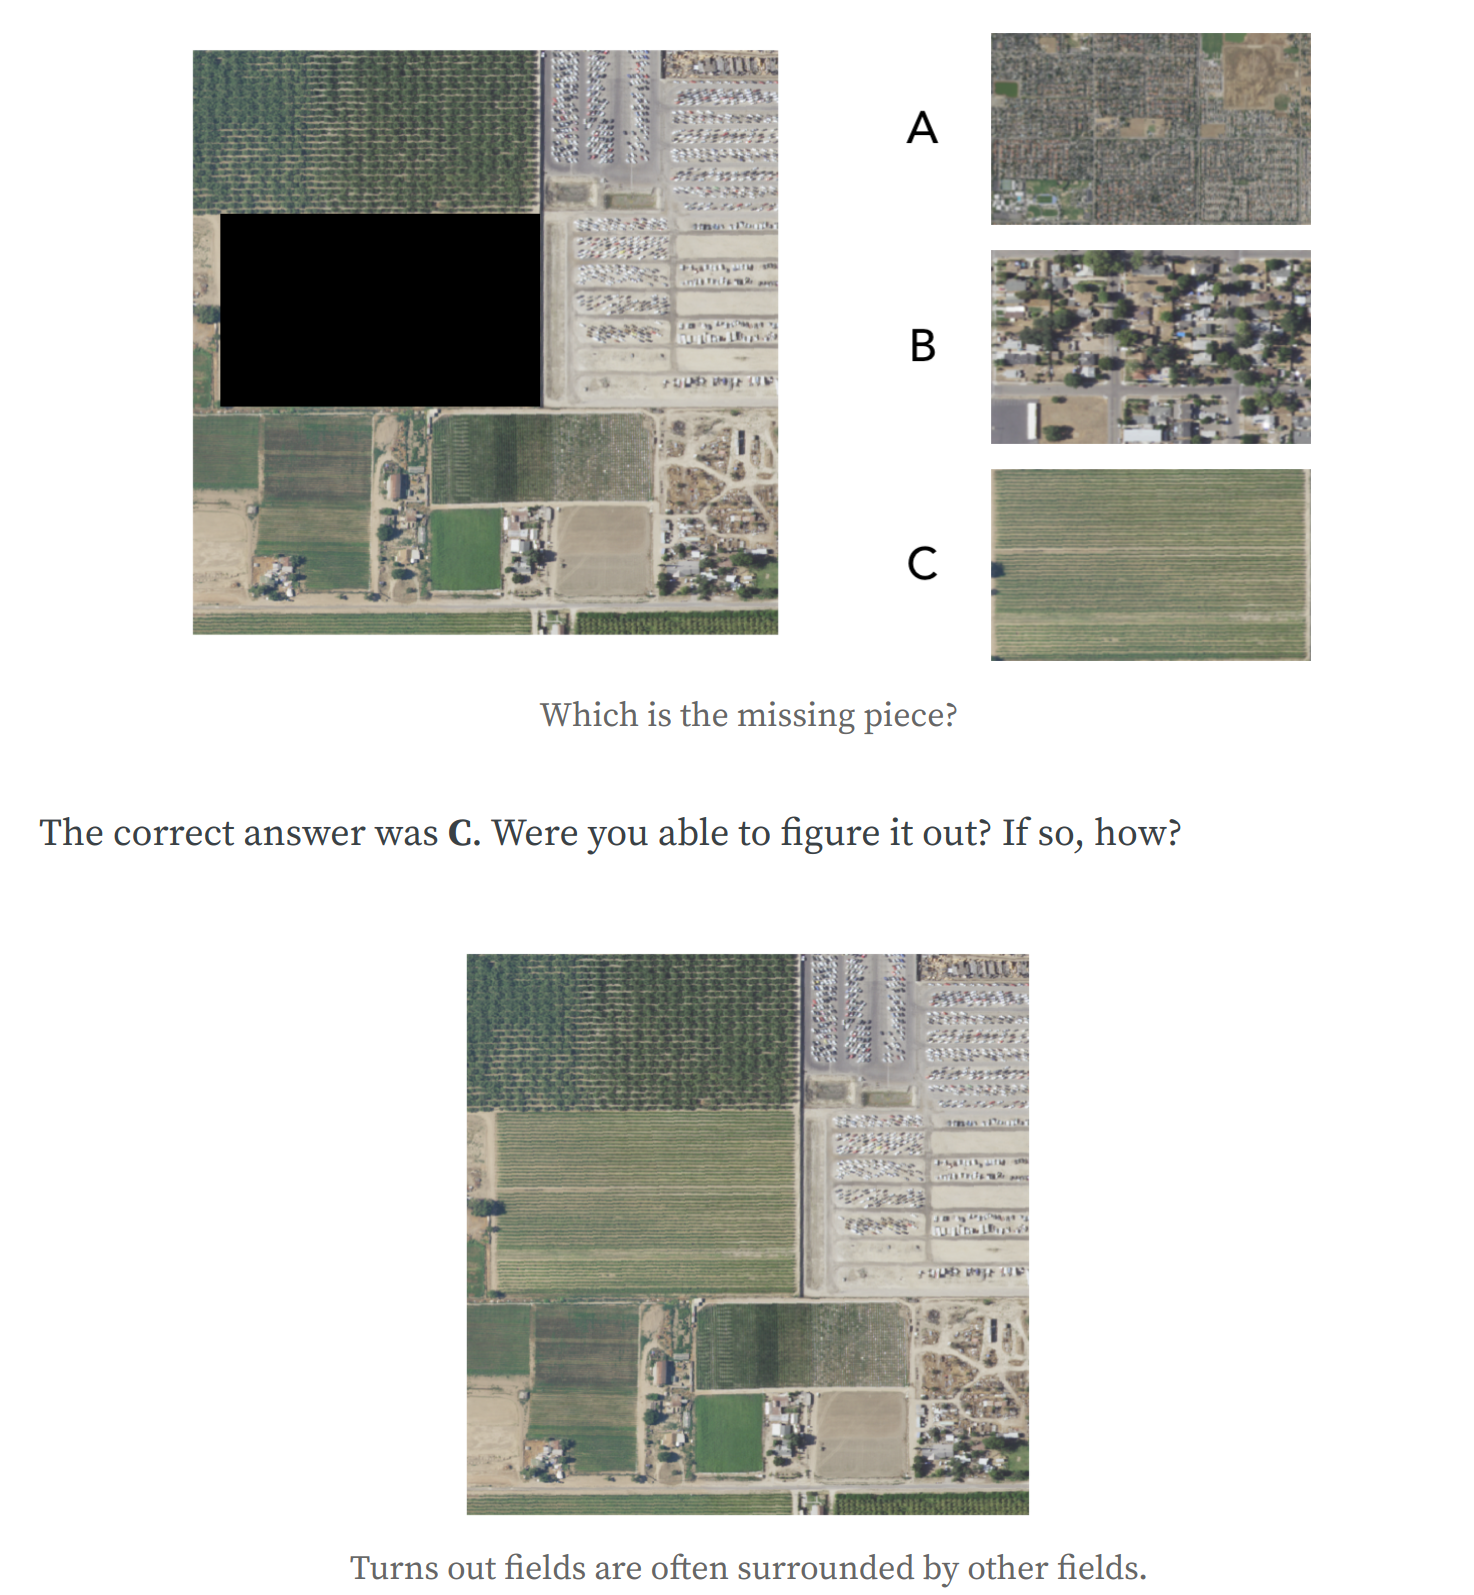
Approach 4 - Tile2Vec
Research by Jean et al 2019
- Based on Unsupervised learning
- This method emphasizes the difference between two satellite images
- Cluster homogeneous-looking areas and assume that some clusters will be specific to poor areas

Comparison of Different Approaches