Distributions
Continous distribution
- Uniform Distribution
- Normal Distribution
- Probability of observing an exact value is zero
- Probability will exist for an interval
- To find the probability of a random variable in an interval, we integrate the probability density function over the interval
- To find the joint probability of two variables between intervals, we double integrate the joint probability density function. For example height between 6.0 and 7.0, weight between 70 and 80 Kgs
Uniform Distribution
- The probability density function for uniform distribution is constant
- It is used for generating random numbers from any other probability distribution
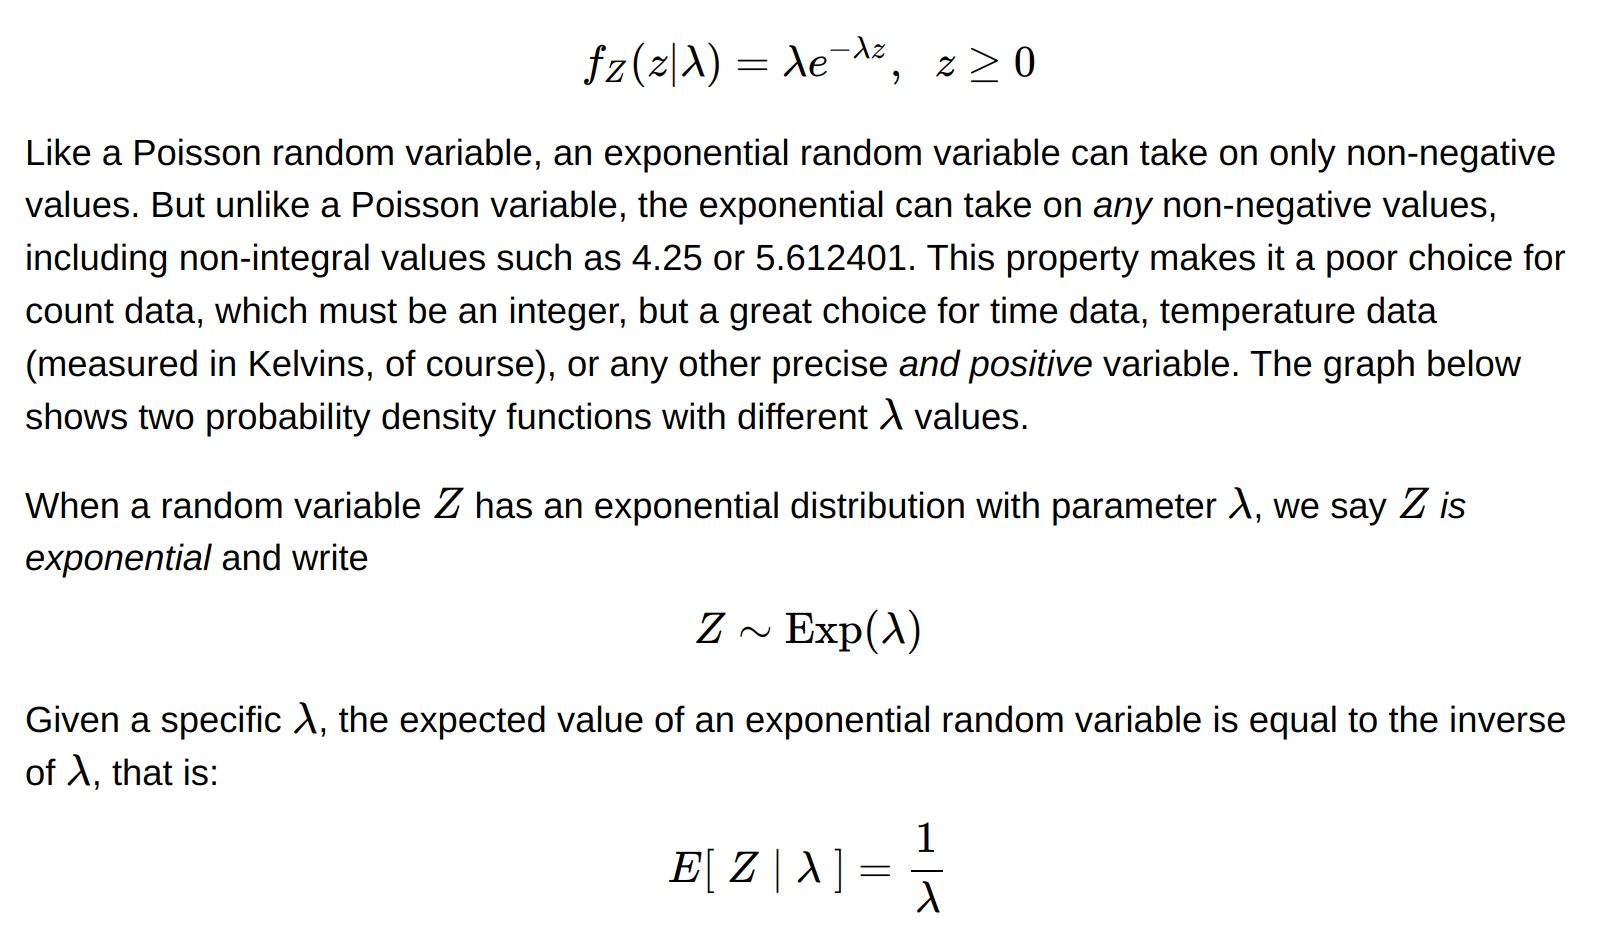
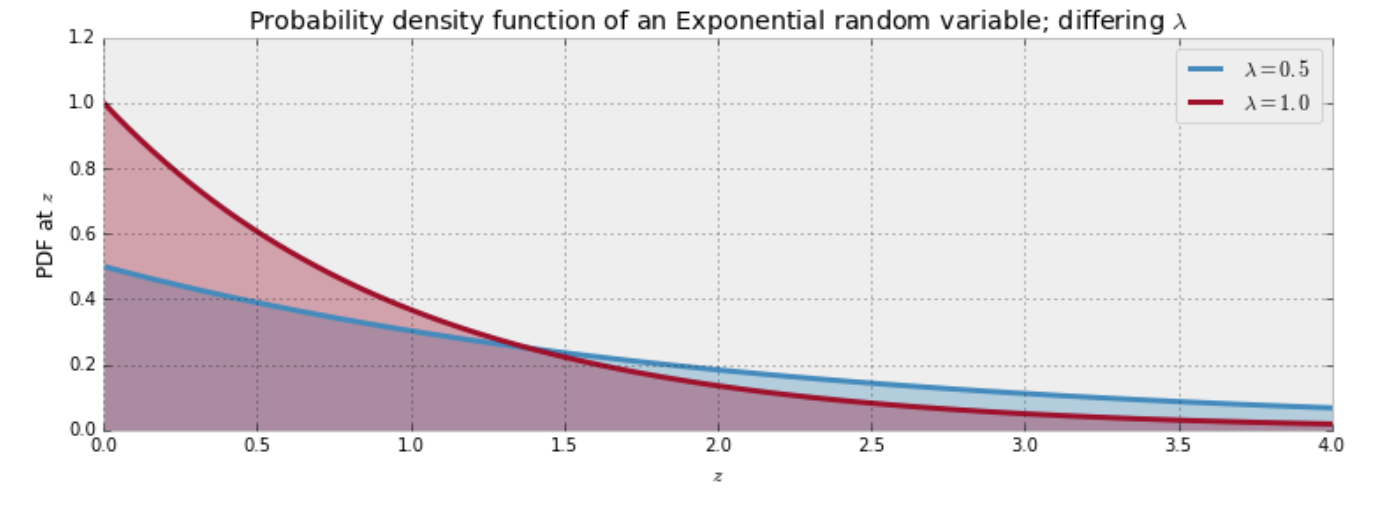
The Exponential Distribution
- If we happen to know that a certain event occurs at a constant rate , then exponential distribution predicts the waiting time until this event occurs.
- The time until a machine part fails - This is very useful for reliability field
The Weibull Distribution
- Similar to exponential distribution but it can model rates which occur with increase or decrease with time
- Used in the field of product life times
- A car will not work if the battery fails, or if a fuse in the gearbox burns out. A Weibull distribution provides a good approximation for the lifetime of a car before it stops working, after accounting for its many parts and their weakest link.
- It is controlled by shape, scale and location
- Exponential is a special case of this distribution - constant rate of event occurrence
The Log-normal distribution
- If we take logarithms of each value provided in this distribution, we get normal distribution.
- This is a good distribution to use when using skewed data with low mean, large variance and assuming only positive values
- Log normal distribution will appear when we take product of many positive sample values
- Parameters - shape, scale and location
- Real world examples
- volume of gas in a petroleum reserve
- The ratio of the price of a security at the end of one day to its price at the end of the day before.
Chi-Squared distribution
- It is a distribution for the sum of squares of normally distributed independent random variables
- Statistical test associated:-
- The goodness of fit test - How far is our expectation from observations
- Independence and homogeneity of data features test
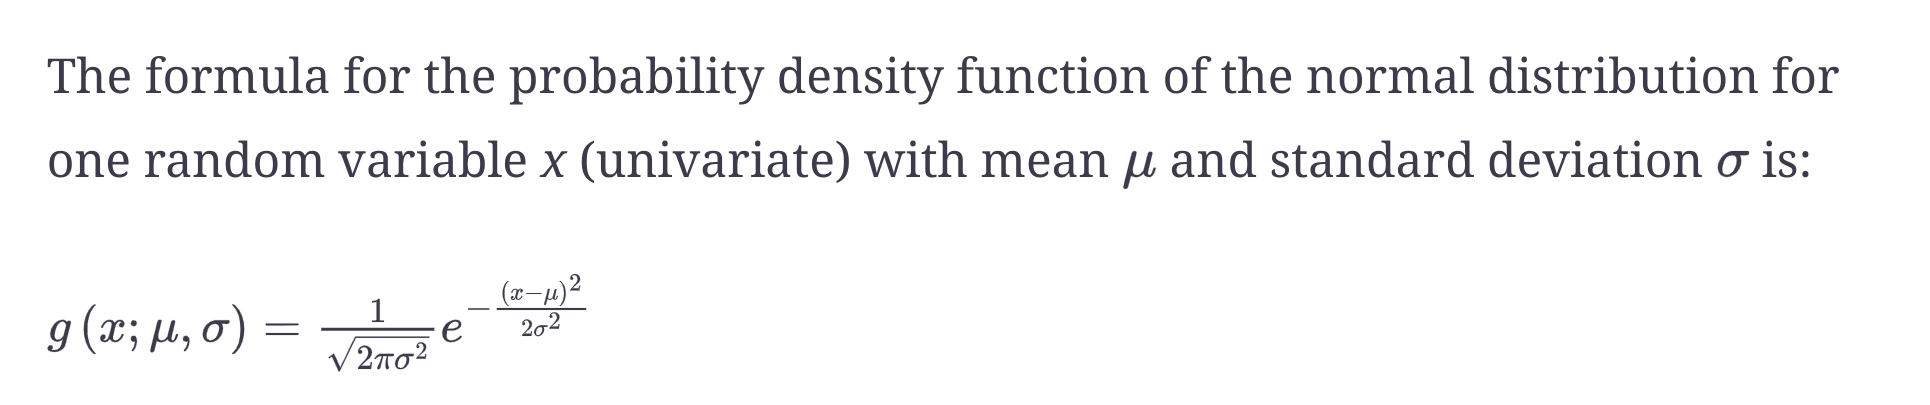
Normal Distribution
- The distribution is symmetrical from the mean
- Mean, Median and Mode are the same
- 68% of the data within one standard deviation, 95% of the data falls within 2 SD and 99.7% within 3 SDs.
- Central limit theorem - The average of independent random samples from any distribution is normally distributed.
- If you happen to find yourself in a situation where you are uncertain and have no prior knowledge about which distribution to use for your application, the normal distribution is usually a reasonable choice. In fact, among all choices of distributions with the same variance, the normal distribution is the choice with maximum uncertainty, so it does in fact encode the least amount of prior knowledge into your model.
Student’s t-distribution
- Used when sample size is small and population variance is unknown
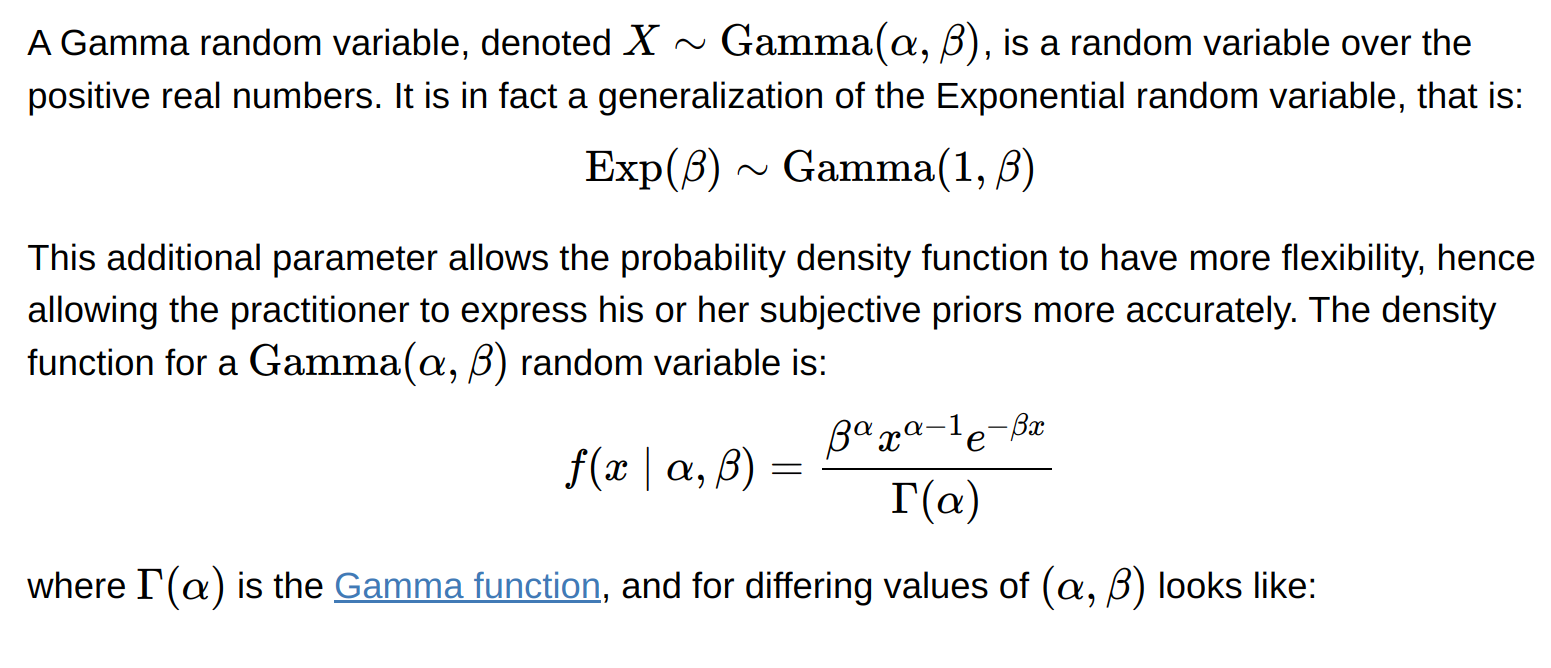
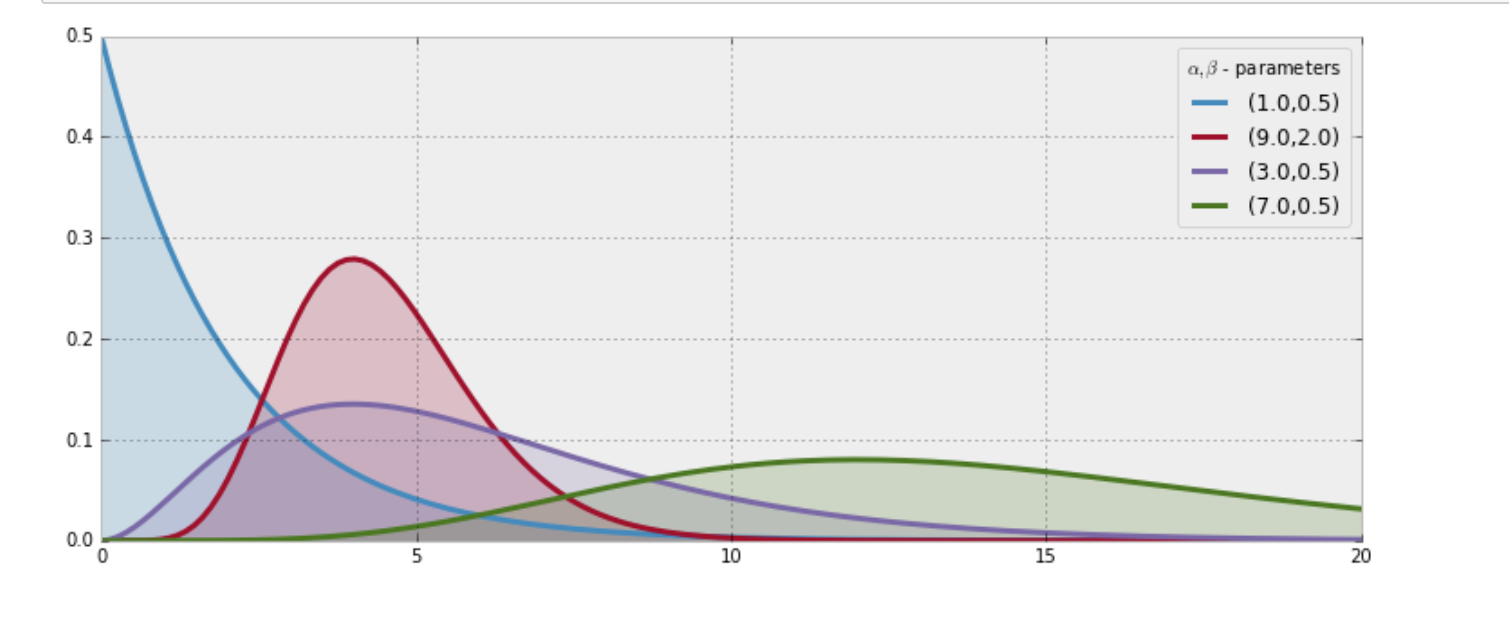
Gamma distribution
- Time until n independent events occur, instead of only one event
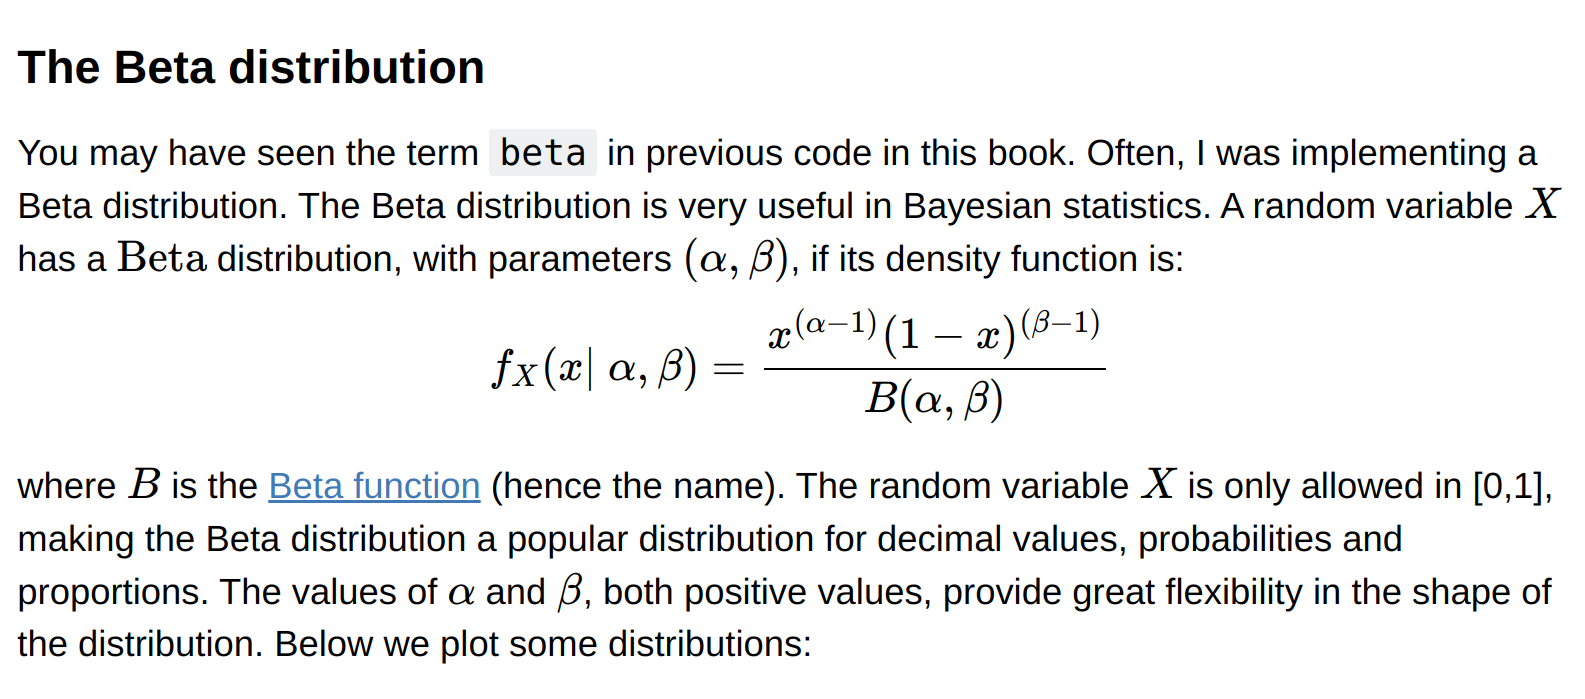
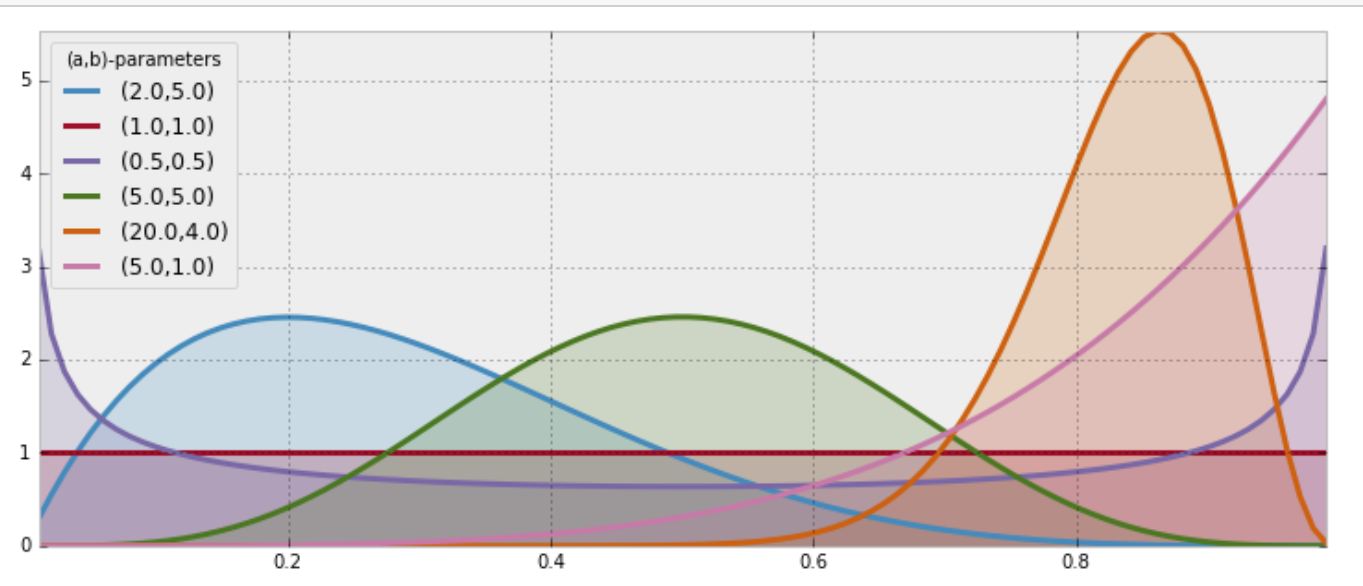
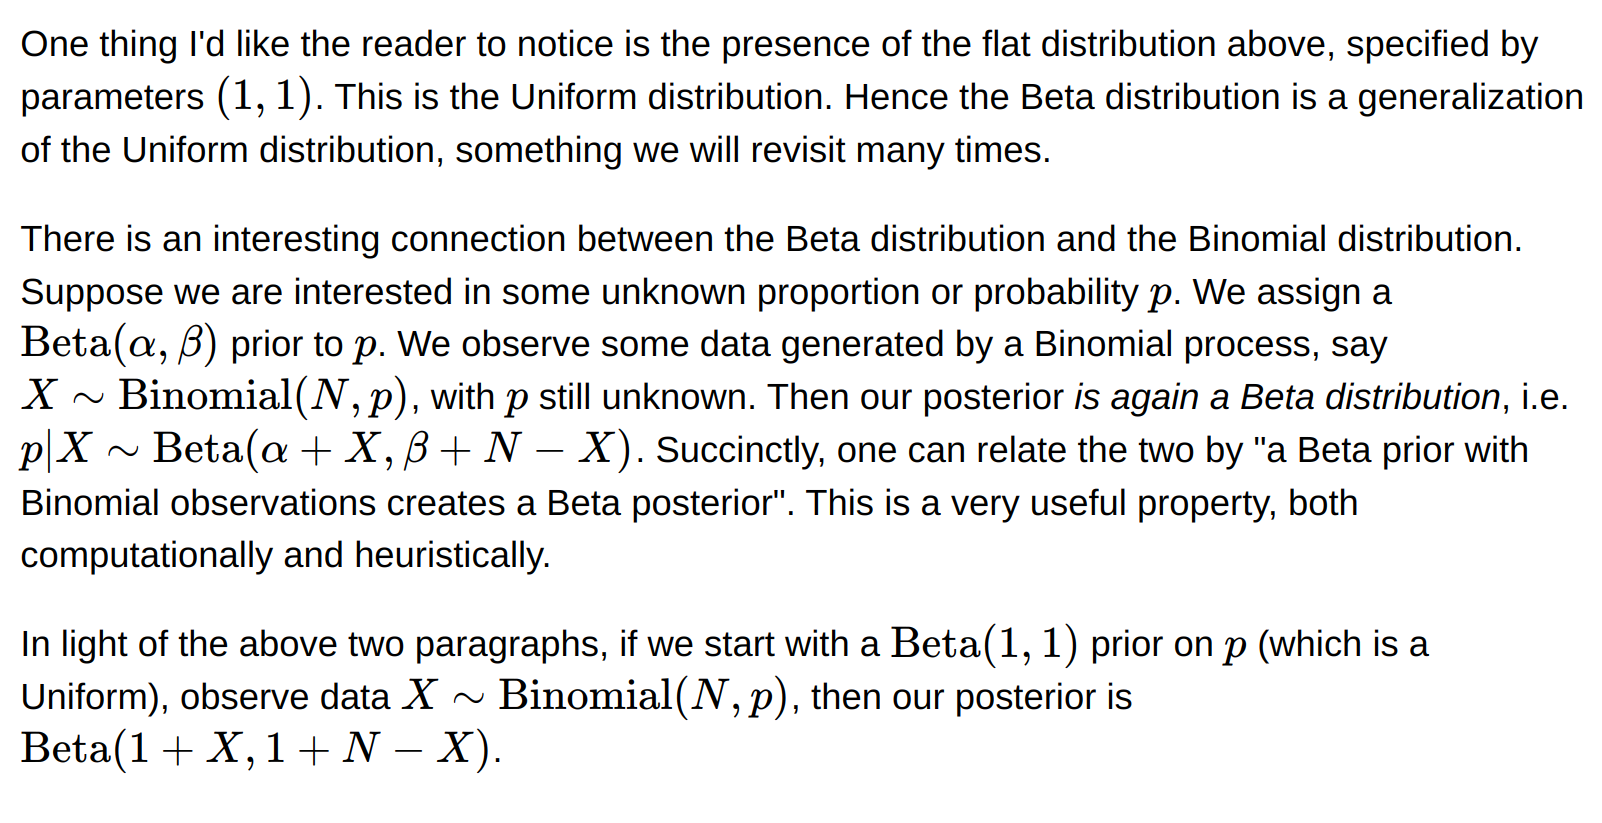
Beta distribution
Discrete distribution
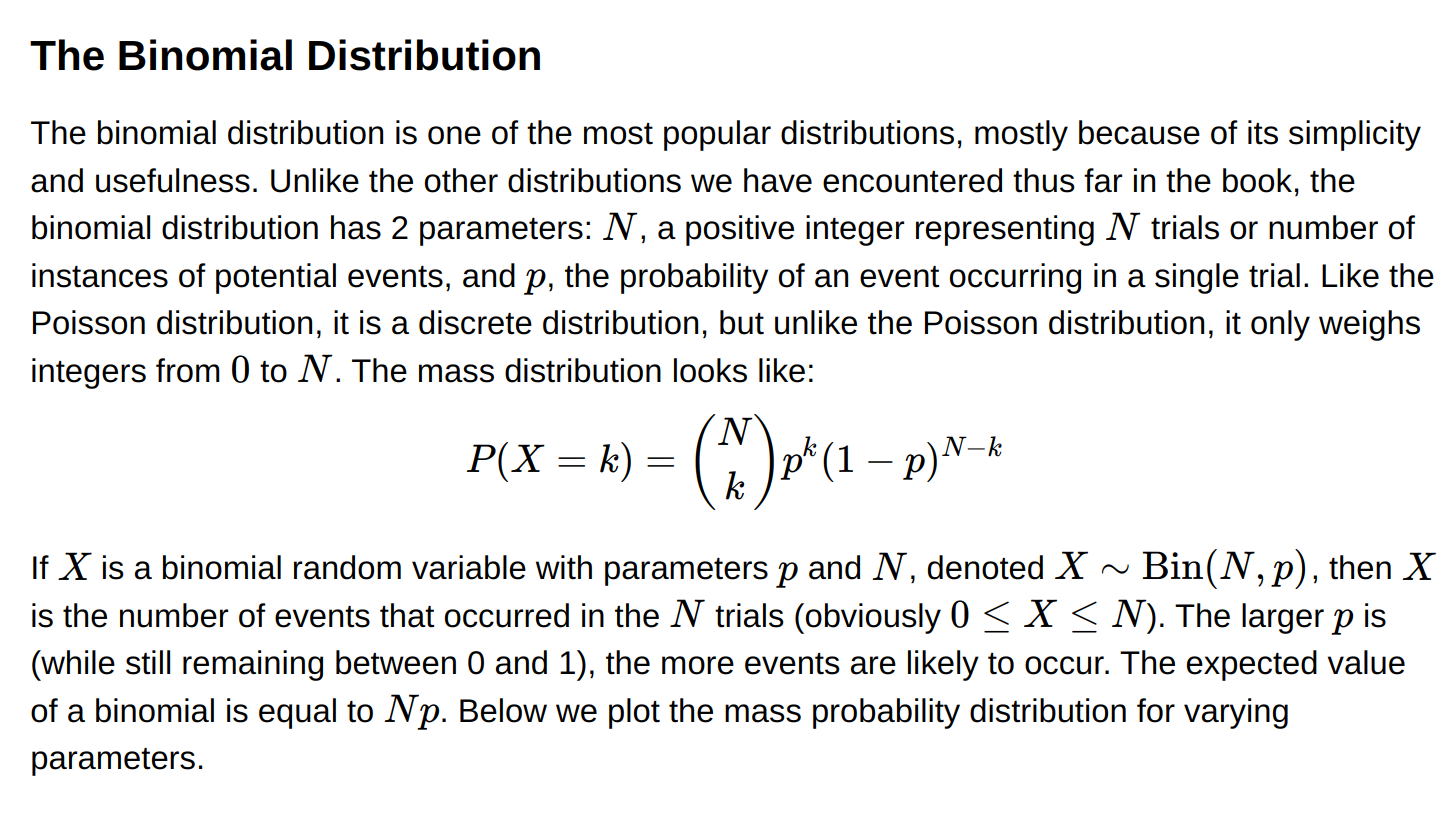
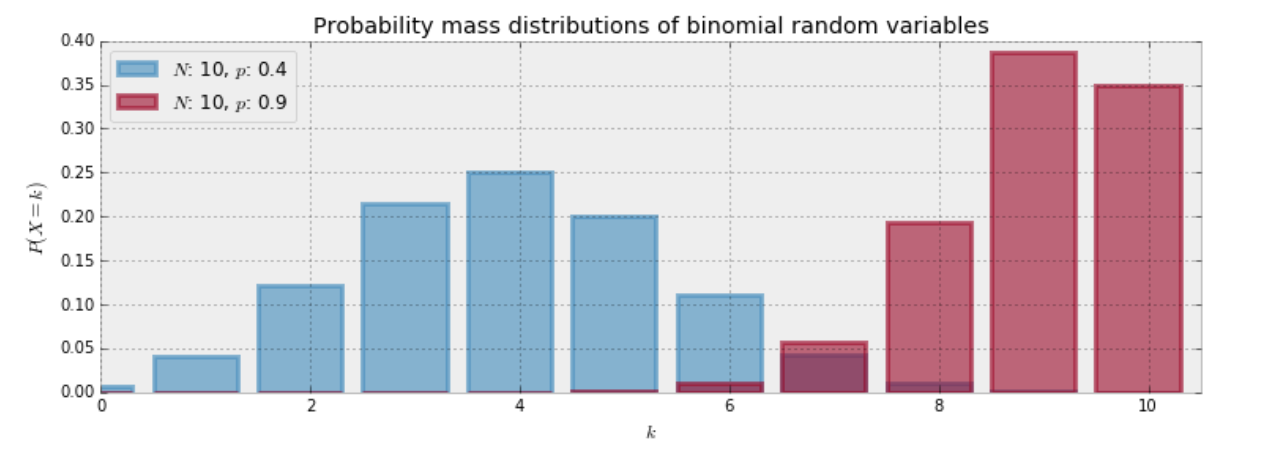
Binomial distribution
- Probability of obtaining a certain number of successess when repeating one experiment,independently, multiple times
- Parameters - n (number of experiments), p - predefined probablity of success
- Real world examples
- Number of patients who will develop side-effects for vaccine
- Number of ad-clicks that will result in a purchase
- Number of customers who will default on monthly credit card payments
 * The special case when N=1 corresponds to the Bernoulli distribution *
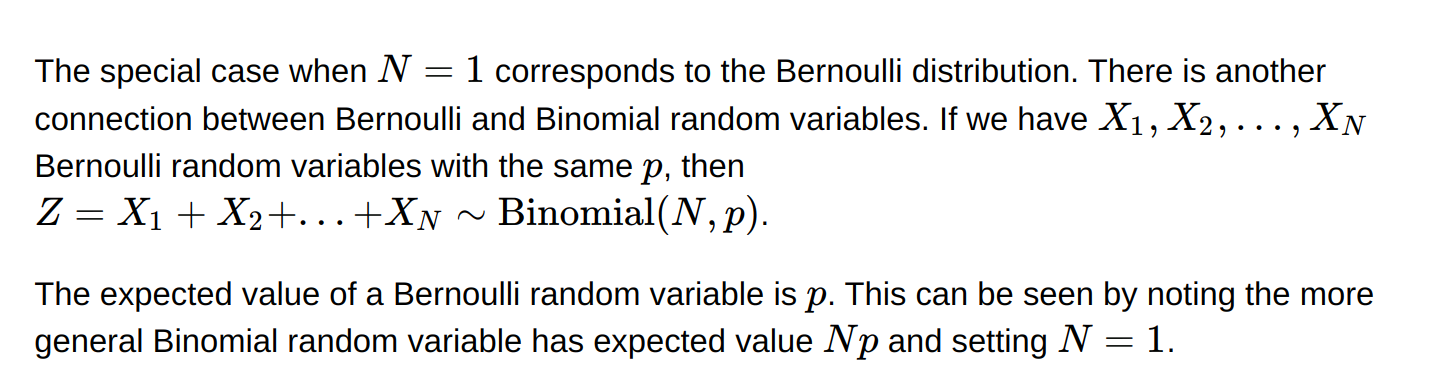
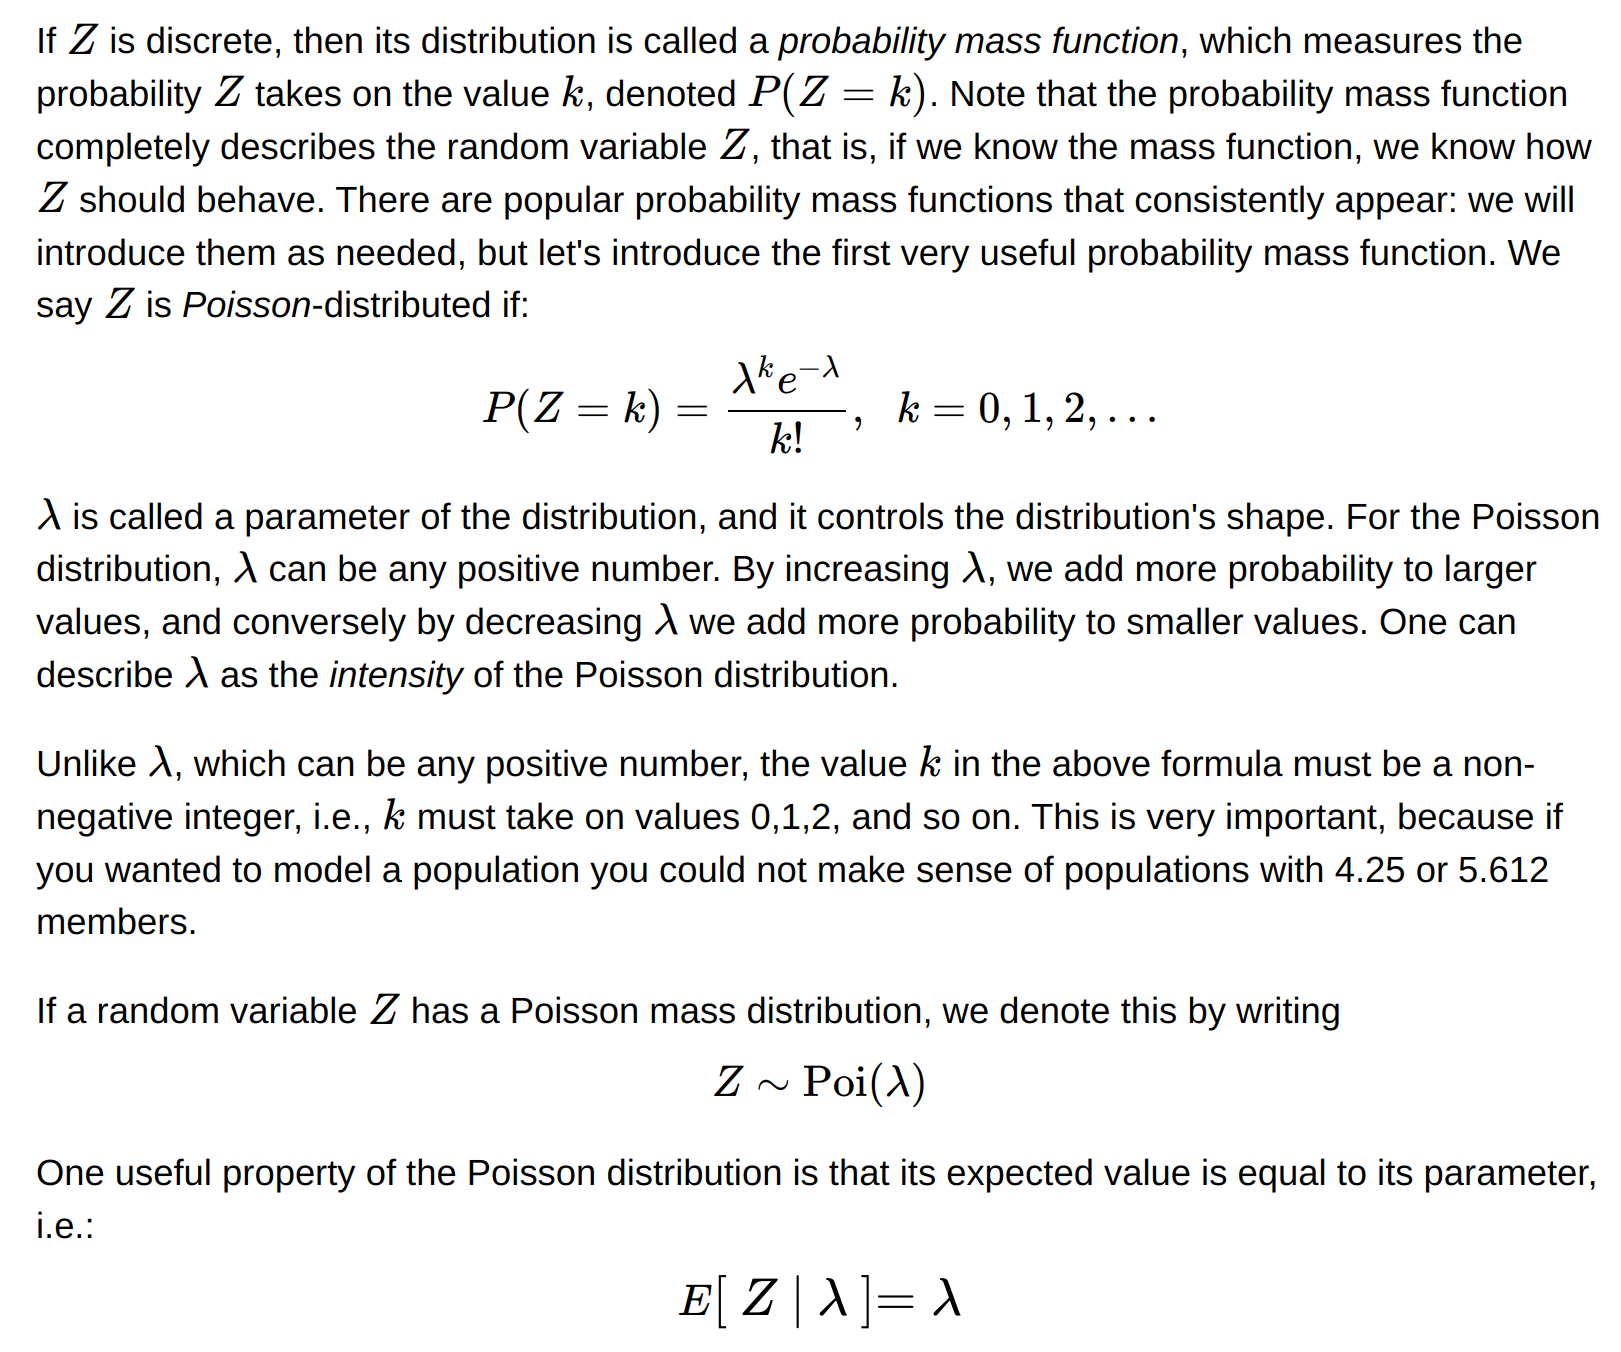
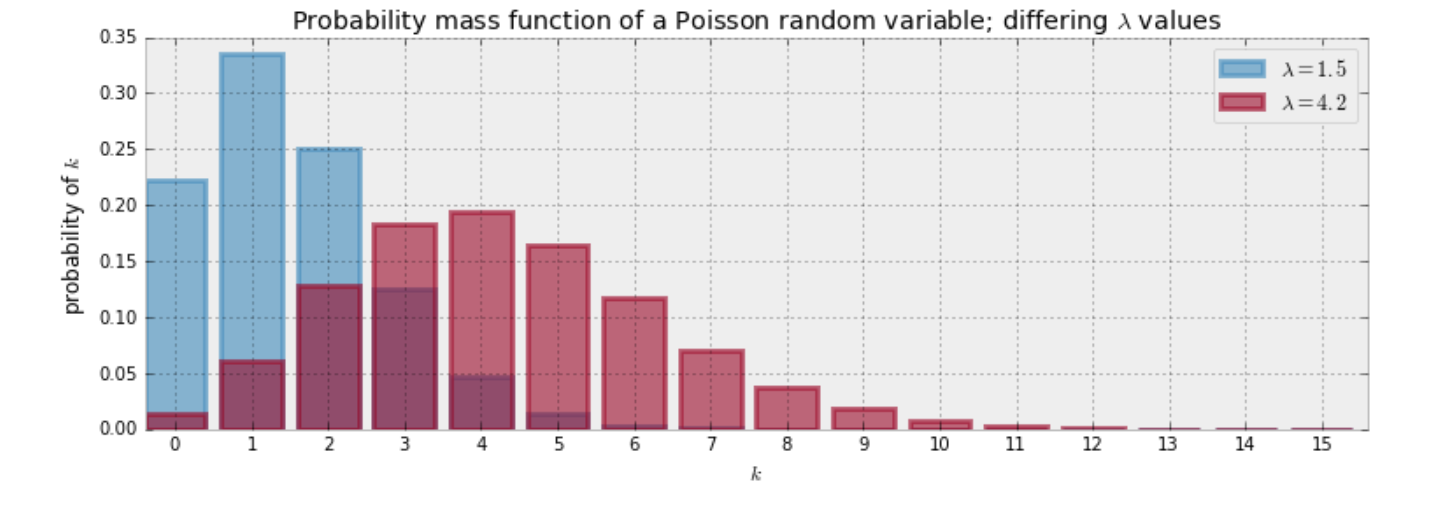
Poisson Distribution
- It will predict the number of rare events that will occur in a given period of time
- parameter - Event occur at a known average rate (lambda)
- Real world examples
- Number of babies born in a given hour
- The number of earthquakes happening within a particular time period
Geometric Distribution
- It predicts the number of trials needed before we obtain a success when performing independent trials, each with a known probability p for success.
- Parameter - Probability of success
- Number of weeks a company can function without experiencing failure
Negative Binomial
- Number of independent trails needed to obtain a certain number of successes
Hypergeometric Distribution
- Similar to binomial but the trials are not independent
Negative Hypergeometric Distribution
- Number of dependent trails needed before we obtain a certain number of successes